Tasked to focus on economics within the city of Glasgow I knew from various research sources that the city has a known employment issue and I wanted to quantify this by area. Using multiple indices of economic need, I hoped to identify architectural and economic opportunities based on the same data used by the government and city councils to inform employment policy and economic investment.
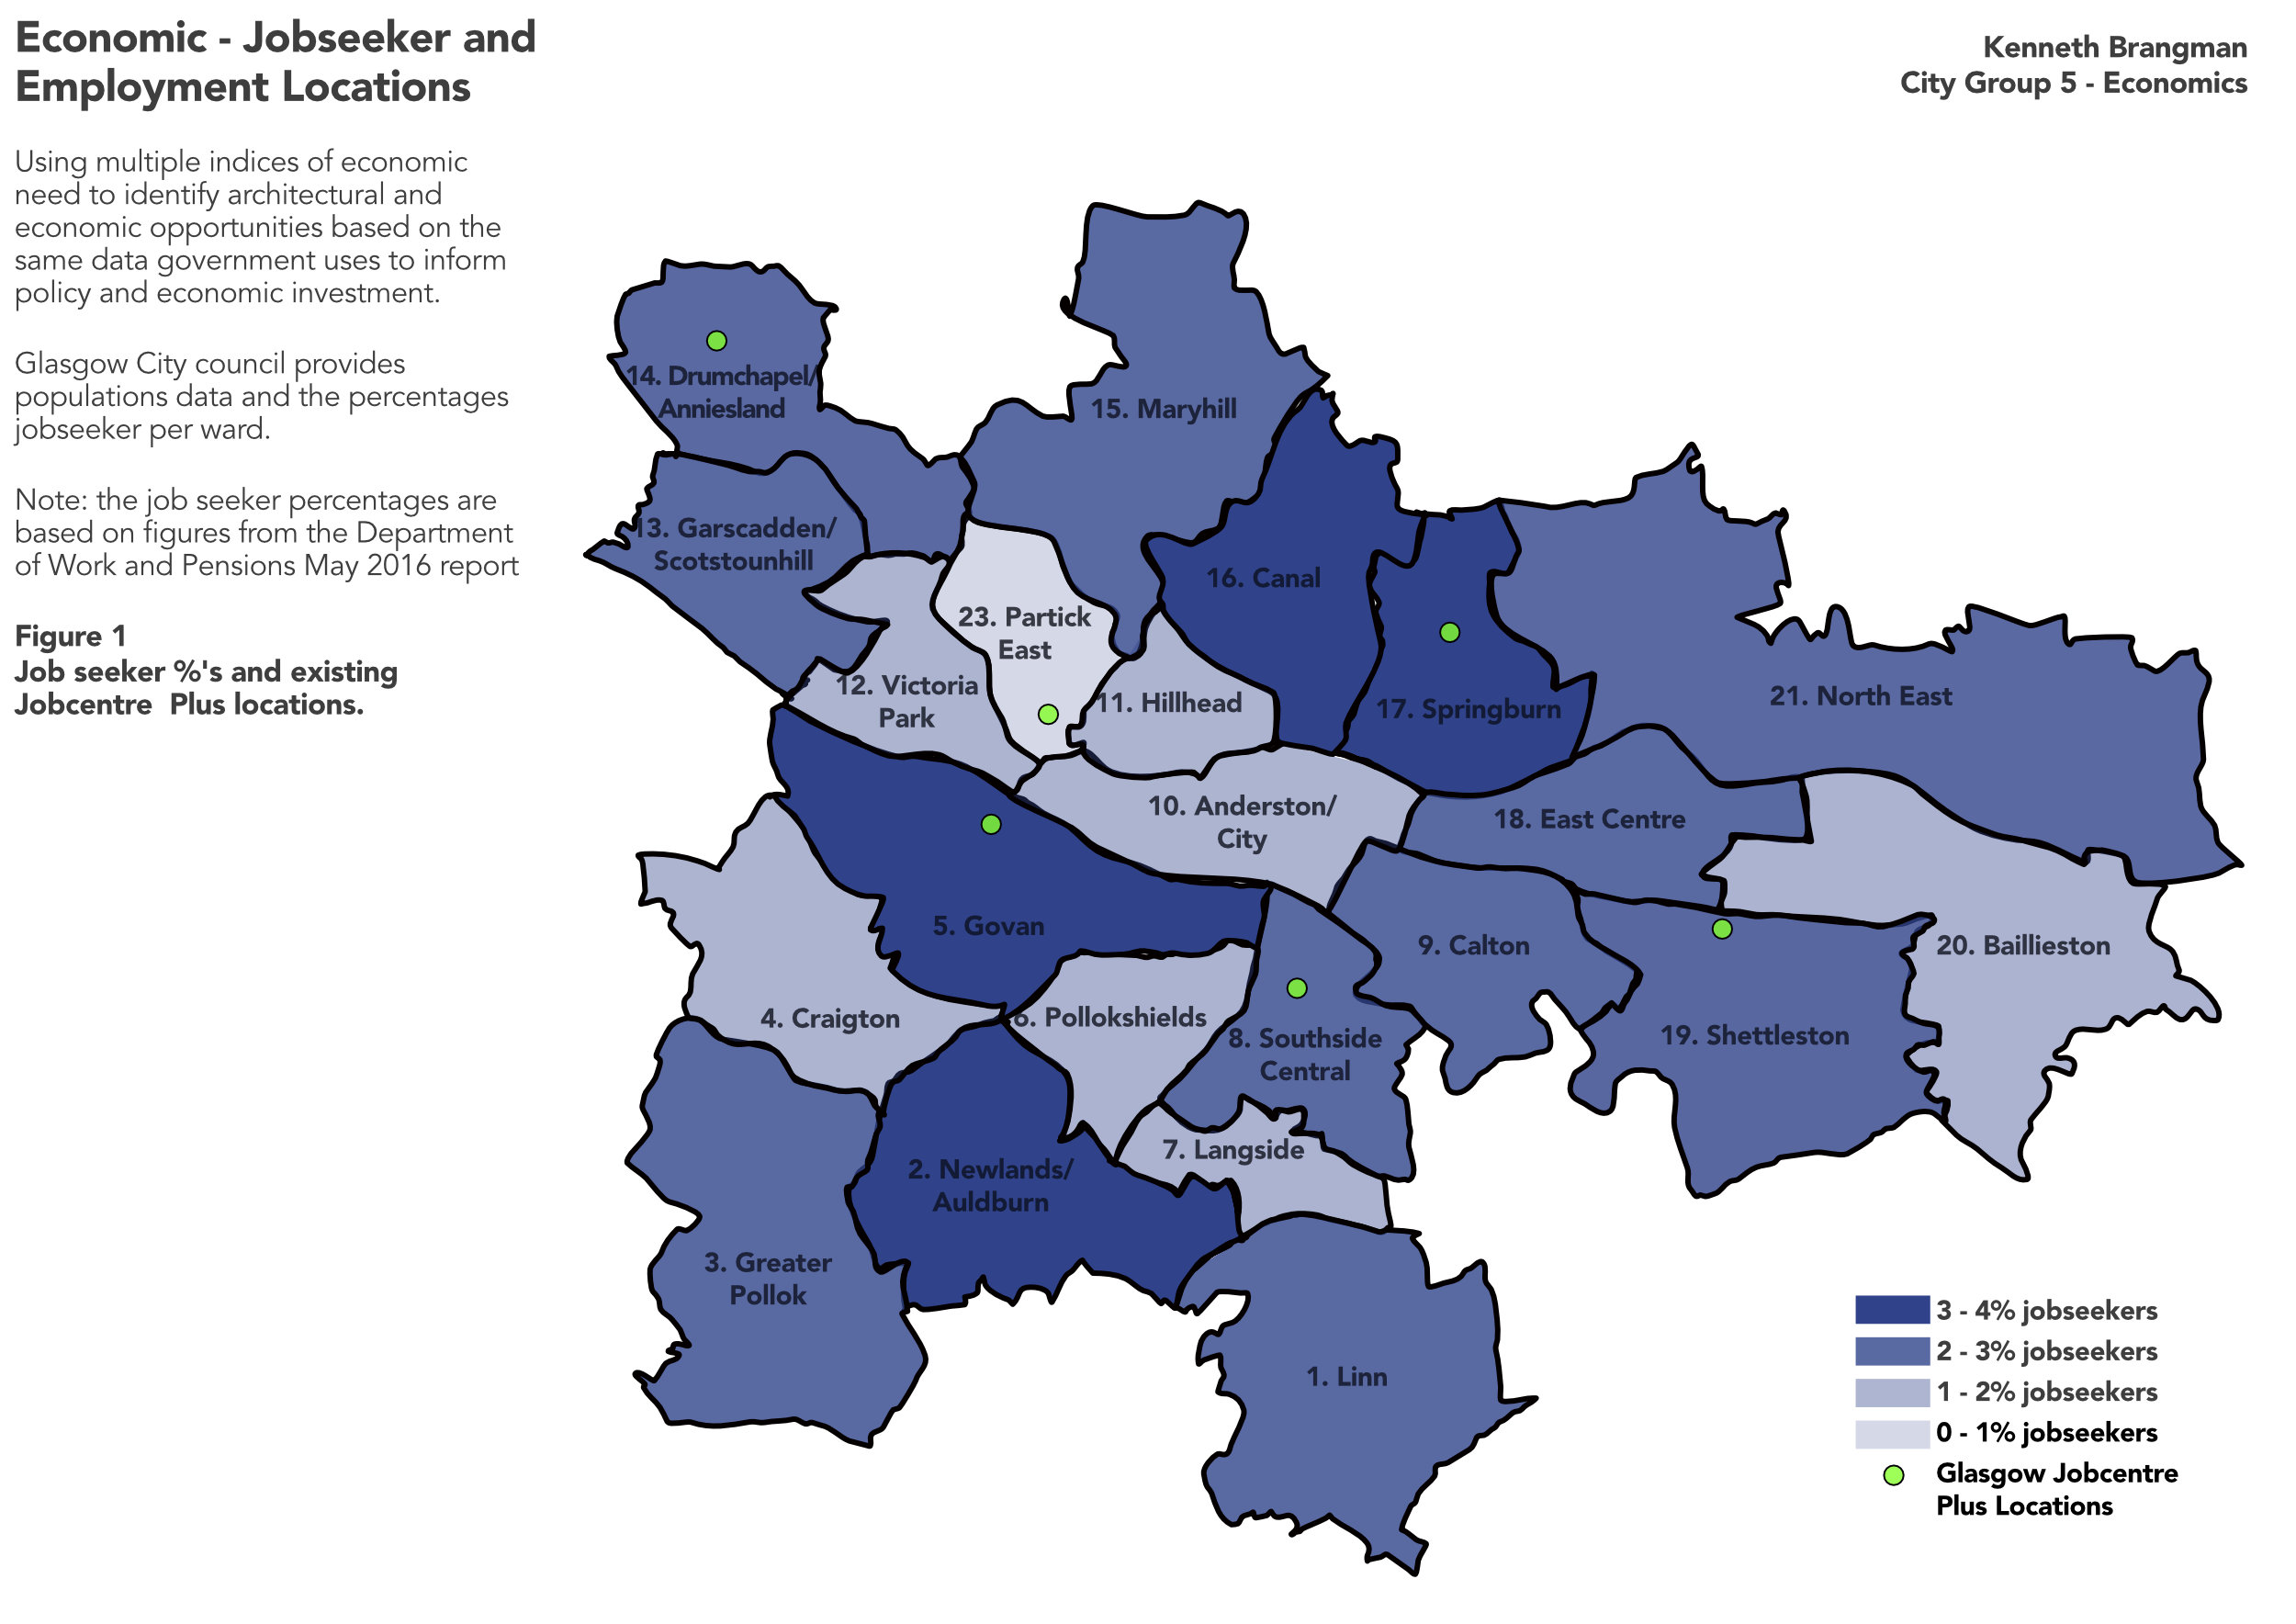
The first figure shows Glasgow City wards and the percentage of their populations who are jobseekers. This data came from the May 2016 Department of Work and Pensions report. Overlaid on this figure I added “Jobcentre Plus” locations to see any current relationship between the job seekers and their physical access to employment facilitators.
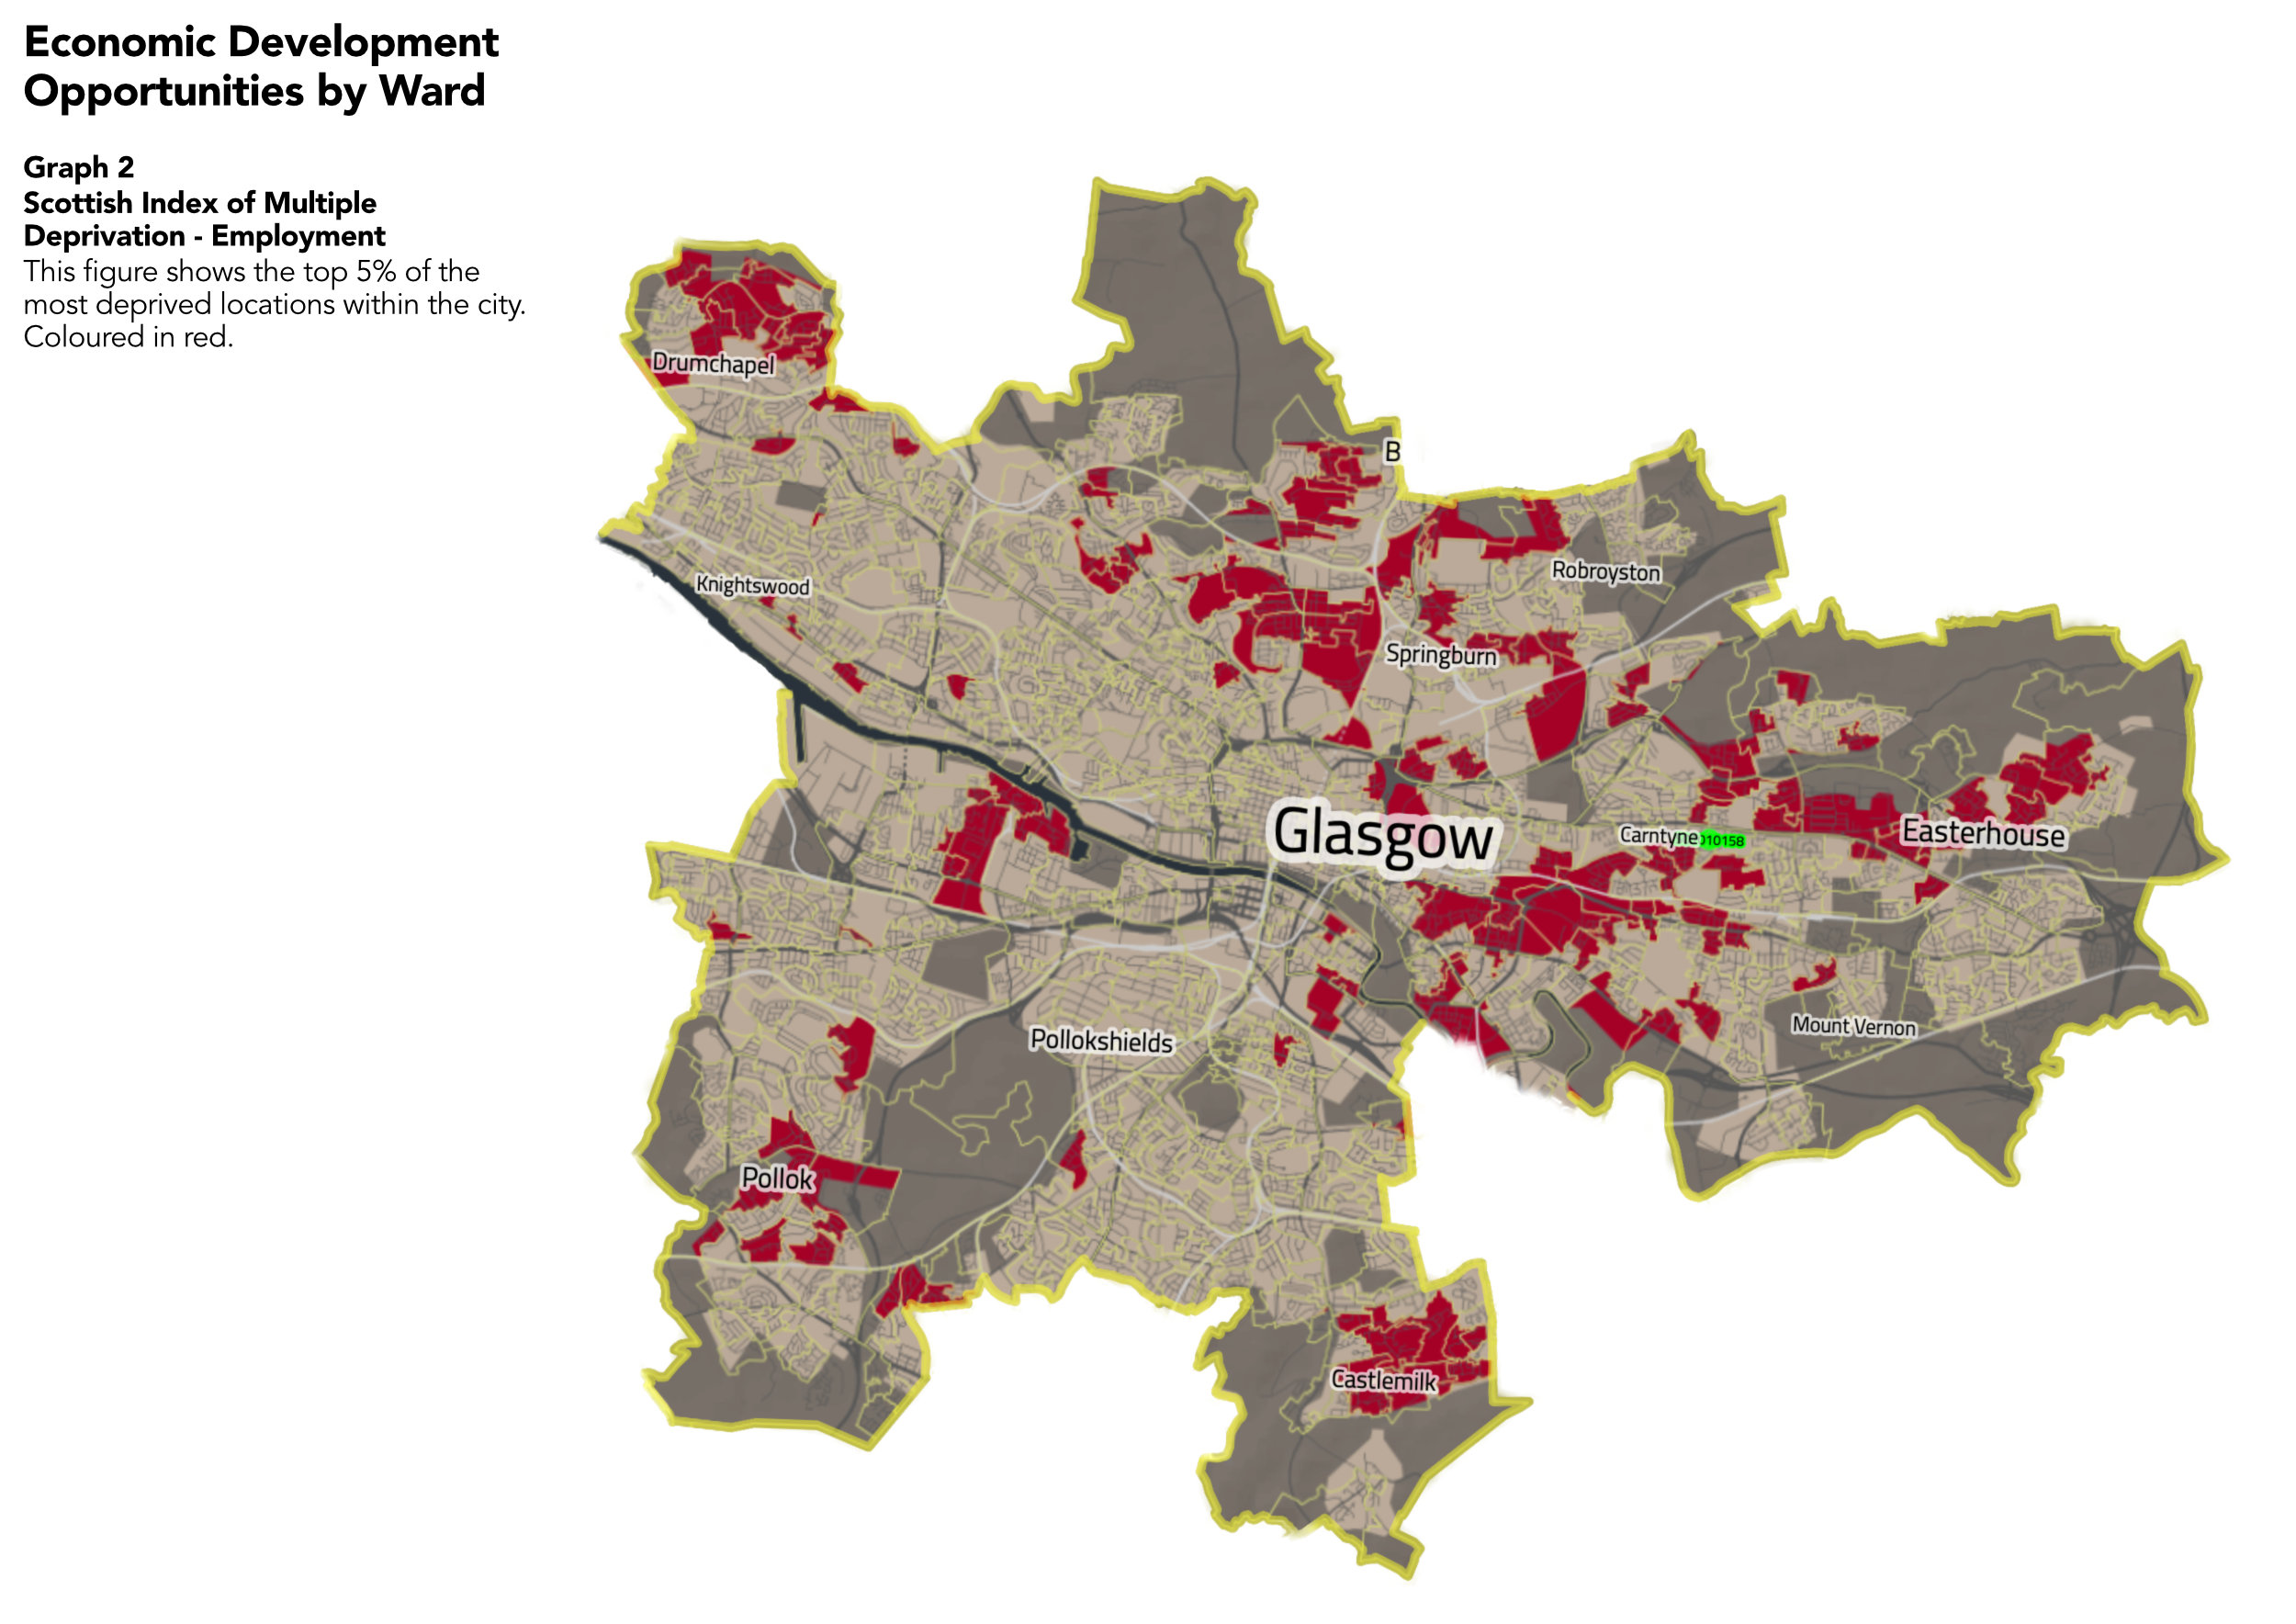
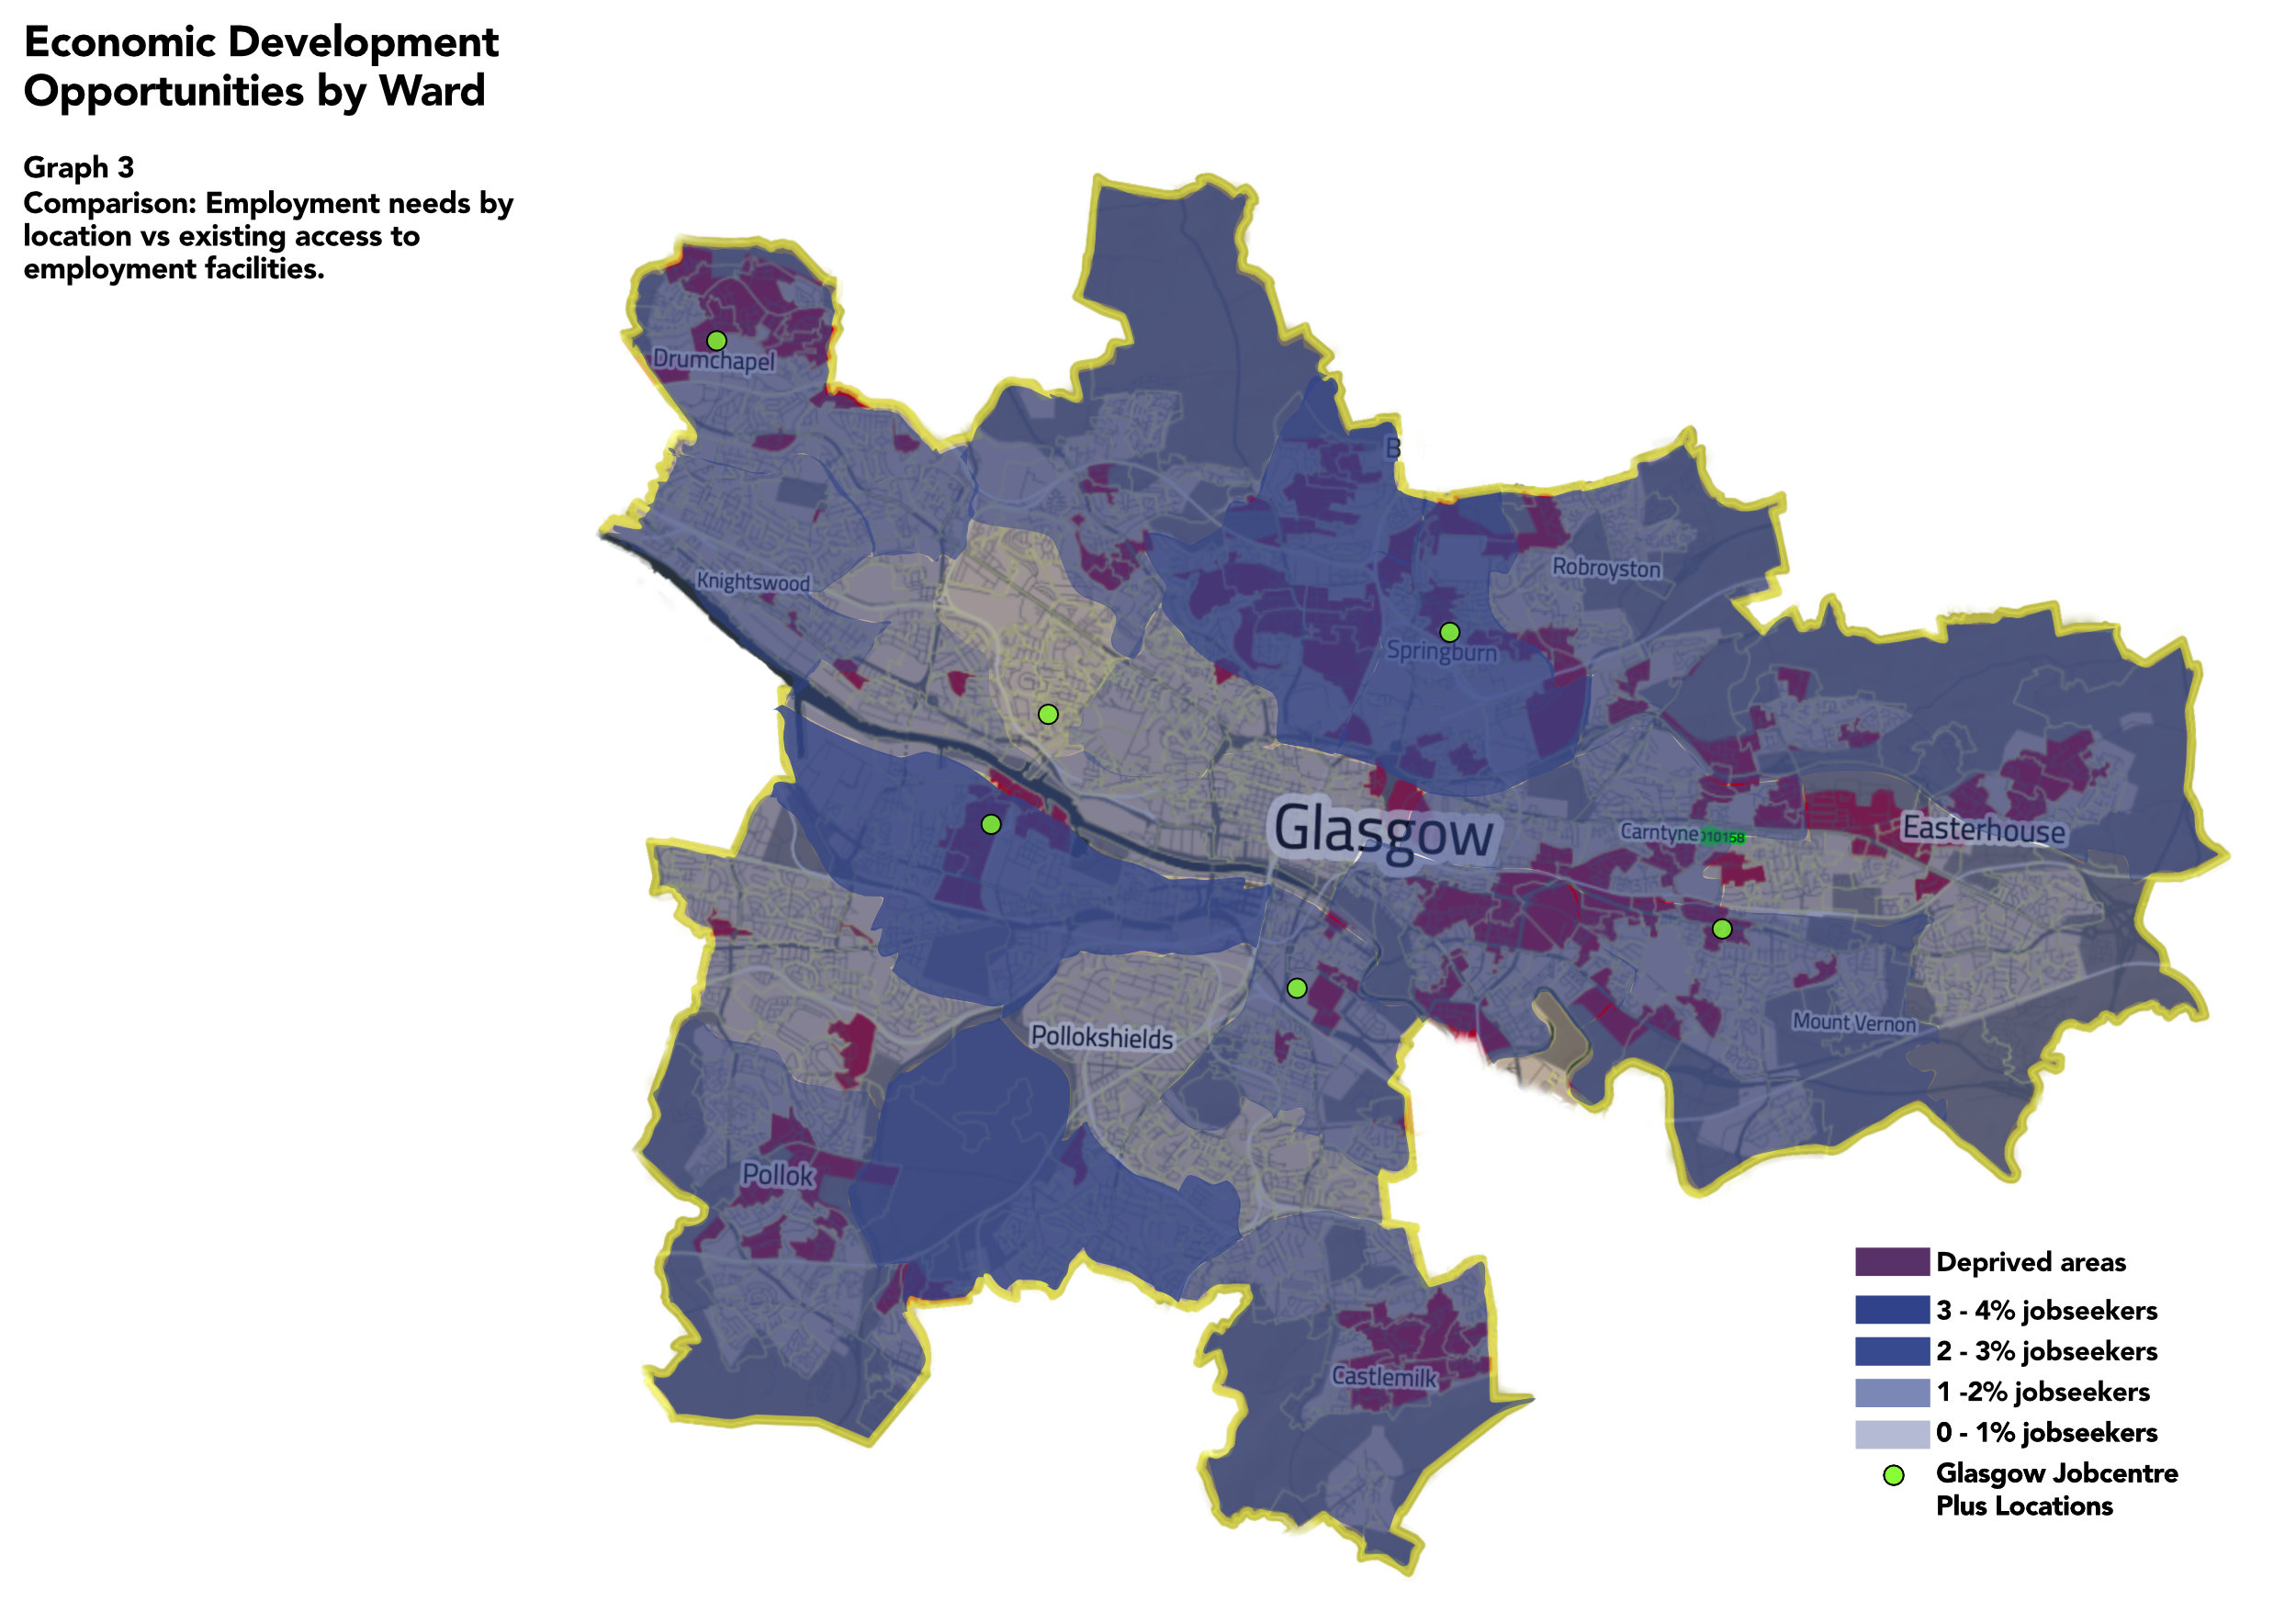
The second figure looks at a 2020 survey, the Scottish Index of Multiple Deprivation (SIMD). This map highlights the top 5% of the most deprived areas of Glasgow. In the third figure I have overlaid the city ward jobseeker percentages over the SIMD map to see if these areas have stayed the same over time and to identify where the most opportunities for employment development are within the city of Glasgow. It is evident that there are deprived areas and locations without access to employment facilities still.
Key Themes: Boundaries, Inequality, Political